
Thursday, October 11, 2012
Skeletal System
New bulletin board! We just started studying the skeletal system so I thought this would be great to have in the classroom. Today we played Simon Says with only using the correct name of bones. It was really helpful for kids to look at the board as we played the game. Tomorrow we are going to be in the lab observing dried rib bones and large beef bones from the butcher. The kids are very excited!
Tuesday, October 9, 2012
Changes in State
Eighth graders were studying states of matter and changes in state. I allowed each student to randomly choose a change in state and they were responsible for creating a cartoon that illustrated the change in state. To give them some guidance, I told them the main characters in their comic should be the particles in each state of matter. In their comic, they would personify the atoms to help explain how their behavior adjusts as the matter changes. Once the comics were completed, I put students in a group to teach their peers about their specific change in state. I made sure that each group had at least one student with each change in state. After each student had the opportunity to teach their group, I split the groups in half and they took a group quiz about what their classmates had just taught them. This was such a beneficial learning experience because students had the responsibility to teach their peers and they had to listen to their classmates and ask questions in order to be prepared for the quiz that followed.
Illinois State Standards:
12.C.3a. Explain interactions of energy with matter including changes of state and conservation of mass and energy.
12.C.3b. Model and describe the chemical and physical characteristics of matter (e.g., atoms, molecules, elements, compounds, mixtures).
Objectives:
Students will:
-illustrate a change in state through a comic
-collaborate with peers through teaching and questioning
Assessment:
 Students were informally assessed through observation and questioning during interactions with their groups. Furthermore, students' understanding was assessed using the group quiz.
Illinois State Standards:
12.C.3a. Explain interactions of energy with matter including changes of state and conservation of mass and energy.
12.C.3b. Model and describe the chemical and physical characteristics of matter (e.g., atoms, molecules, elements, compounds, mixtures).
Objectives:
Students will:
-illustrate a change in state through a comic
-collaborate with peers through teaching and questioning
Assessment:
Students were informally assessed through observation and questioning during interactions with their groups. Furthermore, students' understanding was assessed using the group quiz.
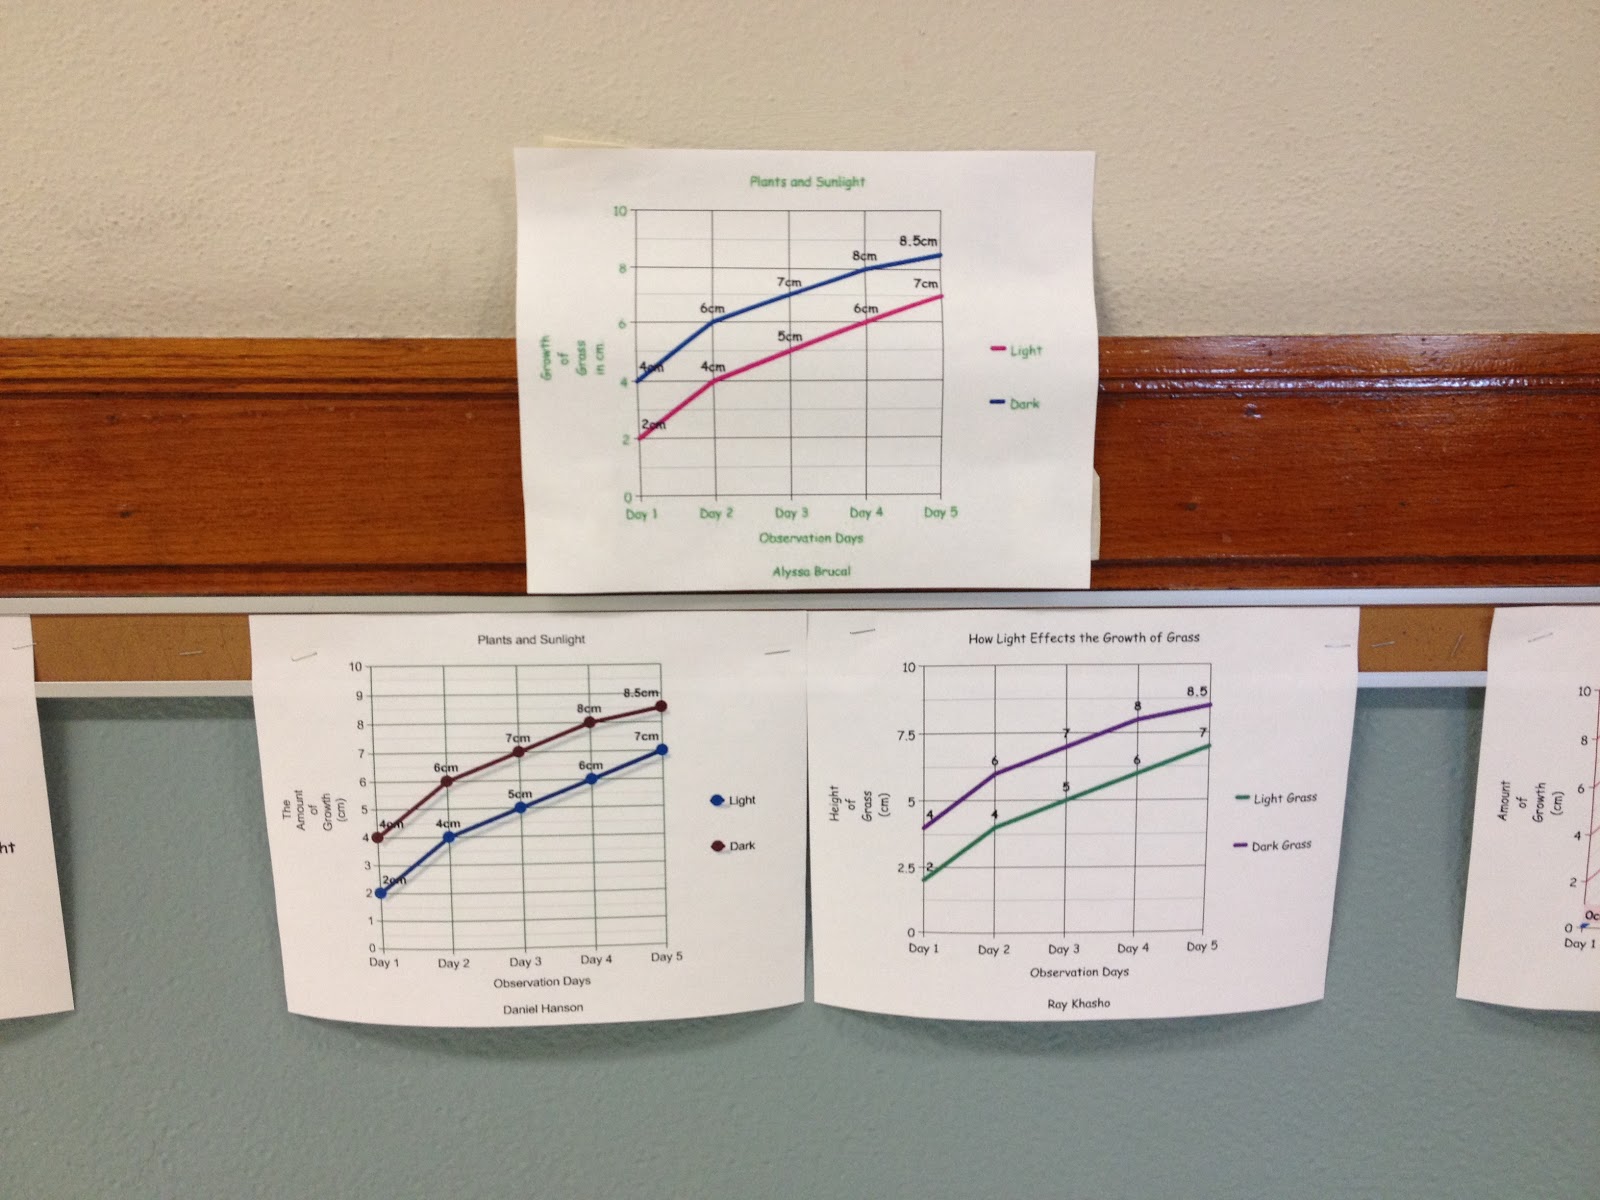
Plant Growth Experiments
In our study of plants, seventh graders designed experiments to see how plant growth is affected by light and water. Students worked in groups to carry out the scientific method. One group tested how different amounts of water affect plant growth while the other groups experimented with the amount of light plant receive.
Illinois State Standards:
 Students were assessed on a lab report that outlined each step of the scientific method. A rubric was used in the grading process.
Illinois State Standards:
11.A.3a Formulate hypotheses that can be tested by collecting data.
11.A.3b Conduct scientific experiments that control all but one
variable.
11.A.3c Collect and record data accurately using consistent
measuring and recording techniques and media.
11.A.3d Explain the existence of unexpected results in a data set.
11.A.3g Report and display the process and results of a scientific
investigation.
Objectives:
Students will:
-collaborate with peers to carry out the scientific method
-design an experiment to determine how plant growth is affected by varied amounts of light and water
-create appropriate data tables and graphs to display results
Assessment:
Students were assessed on a lab report that outlined each step of the scientific method. A rubric was used in the grading process.First Art Lesson
So this year, each classroom teacher is responsible for teaching art to their homeroom. Although I knew this would be challenging at times, I was very excited for this chance to be creative and see my students' creativity. Luckily, I found this helpful website: Art Lessons. The first project I had my students work on were self portraits. These were unique self portraits because half of them are realistic and the other half are abstract. They used symbols that represent them to form the abstract side of their portrait. This was definitely a challenging first project, especially for not having much art education background, but it was fun for both me and the students.
Here are the final products!

Topographic Maps
The first chapter in sixth grade science discussed landforms, maps, and globes. The most unfamiliar map for them was the topographic map. We spend a great deal of time interpreting these maps, making our own keys, and understanding what information the map can provide. To enforce the students' understanding, they created their own topographic maps. I provided each group with a clay "landform", a pie pan covered in plastic wrap with a small opening to pour water, a beaker, and water. Students placed their landform in the pie pan and poured water into the pan in intervals of 200mL. Each time they they poured 200mL, they used a dry erase marker to trace the outline of the water around the clay landform. As they continued to do this, they created multiple contour lines showing the elevation of their landforms. From there, student created a key for their map. Here are some of the topographic maps.


Subscribe to:
Posts (Atom)